2021-2023
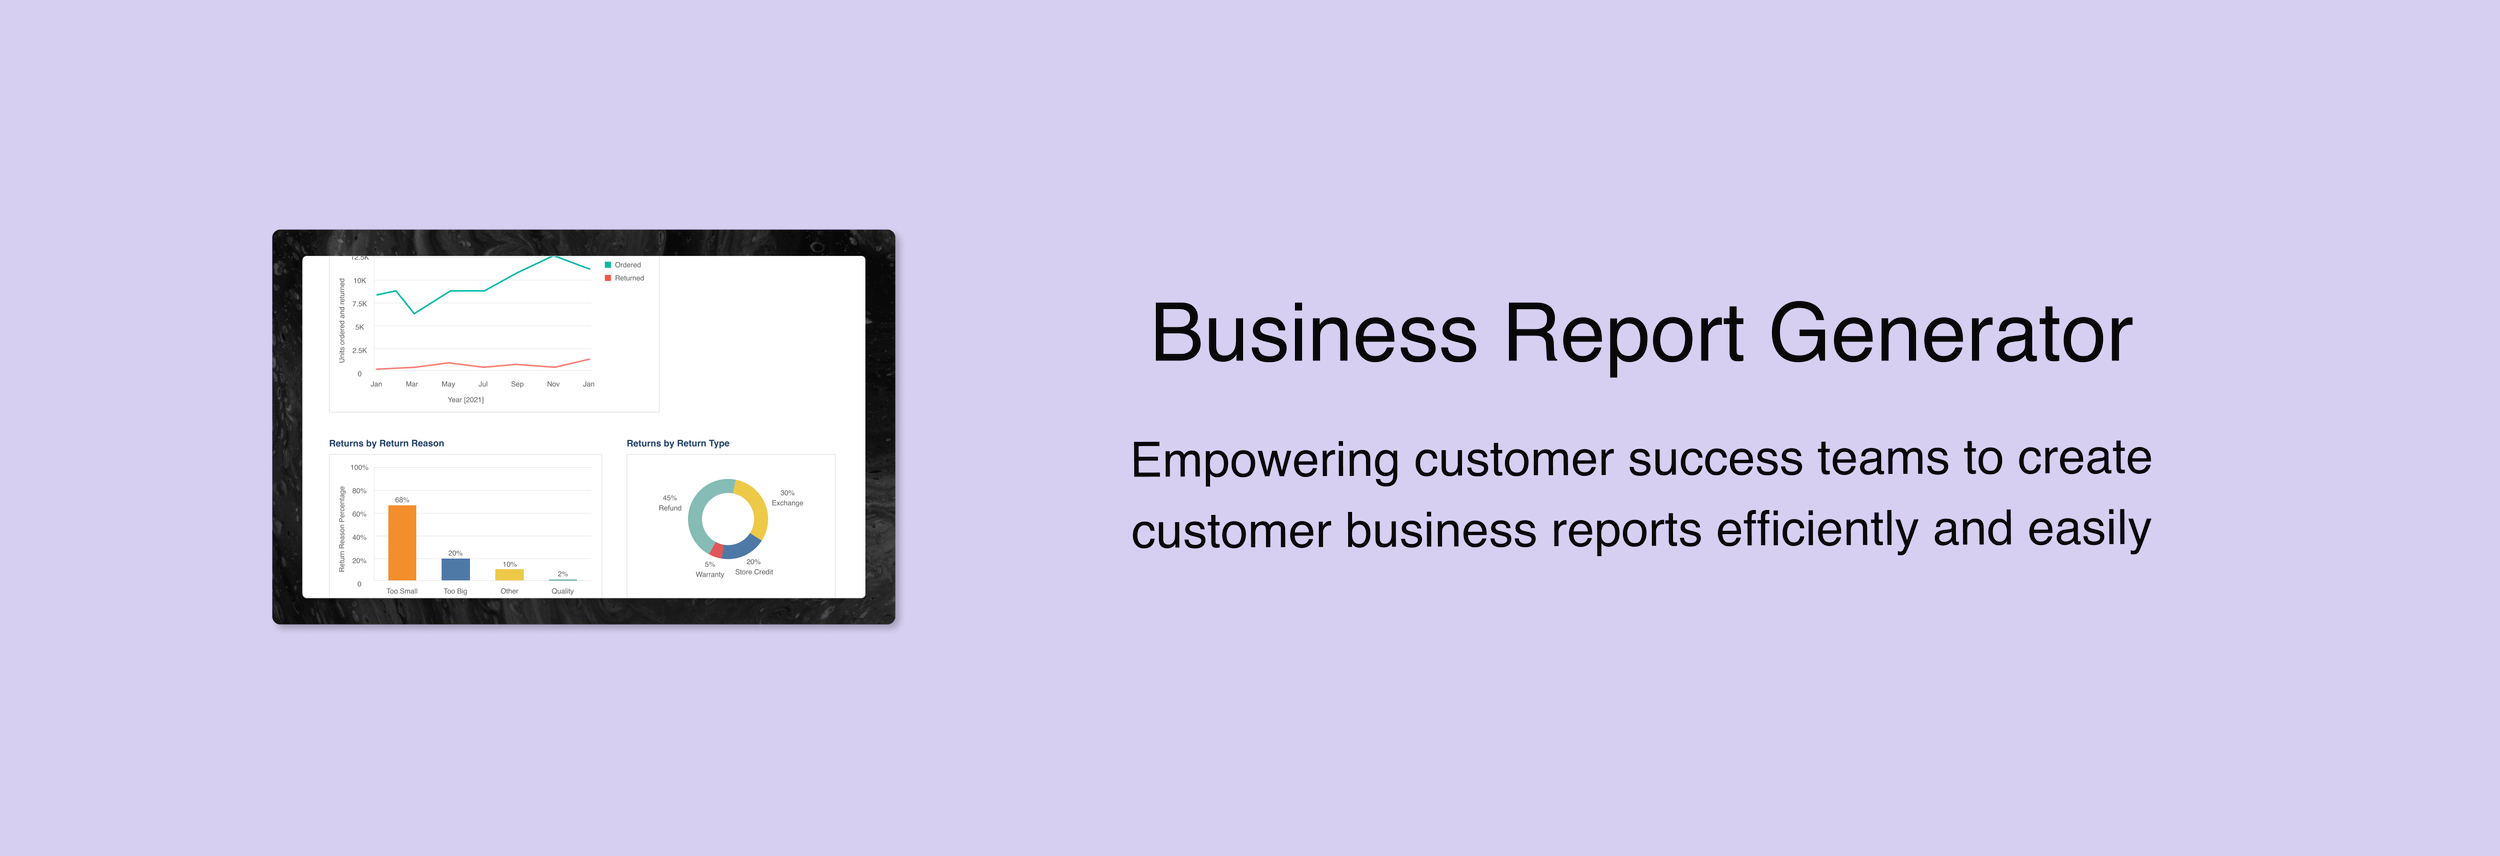
ReturnLogic, a SaaS B2B startup in returns management and post-purchase experiences, offers comprehensive solutions from a shopper returns center to a retailer platform equipped with powerful tools to manage warehouse and operations.
The Current State of Data Visualizations
Data in the returns management space can be leveraged to help e-commerce retailers better understand shopper returns so that they can take restorative measures to reduce return rates.
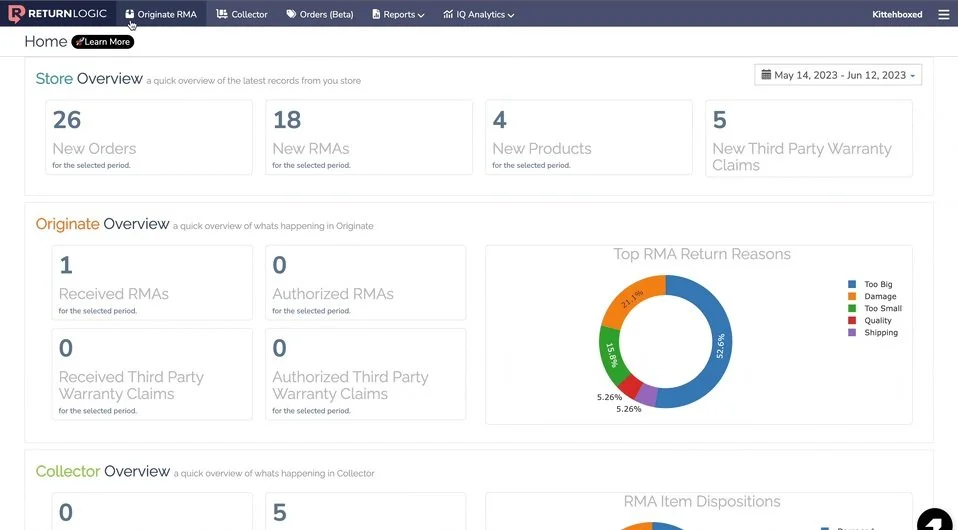
We were exploring a tiered-access plan for returns data reporting. As a pilot offering in the short-term, the Customer Success (CS) team has taken the responsibility of coordinating and sending business review reports to interested retailers – these reports packaged some key data visualizations and returns analytics. In turn, we can gather retailer feedback and gauge retailer interest and engagement.
The Problem
Despite the overwhelming enthusiasm for these reports, after putting together a couple, the CS team expressed that these reports are too time-consuming and manual.
How may we create a solution that makes generating the business review reports quicker, more efficient, and less manual for CS?
Unpacking Internal Frustrations
I conducted interviews with CS team members who have created business review reports to understand their pain points, wants, and needs.
I learned that:
Annual reports can take 30 - 60 mins for 50+ retailers.
Quarterly reports take 1 - 2 hours for 20+ retailers.
Advanced reports are created entirely by our data engineer due to the level of complexity and personalization, so these reports do not factor into CS pain points.

Reviewing Retailers’ Perspectives
I also reviewed any existing retailer feedback to better learn about the state of business reviews today. Interesting highlights included:
Retailers tend to be interested in similar kinds of data, so data engineer often revisits prior work.
Retailers love these business review reports, and many expressed interest in continuing them even with additional premium.
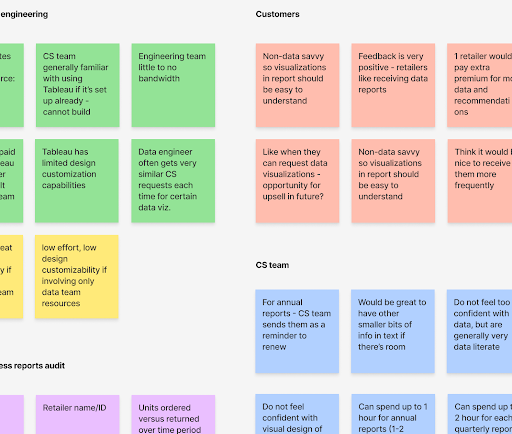
Synthesizing Everything
In short, CS members felt that because they are not technical data professionals or have any visual design training, they could not make business review reports efficiently.
I started by conducting an affinity mapping session to organize and make sense of all the information
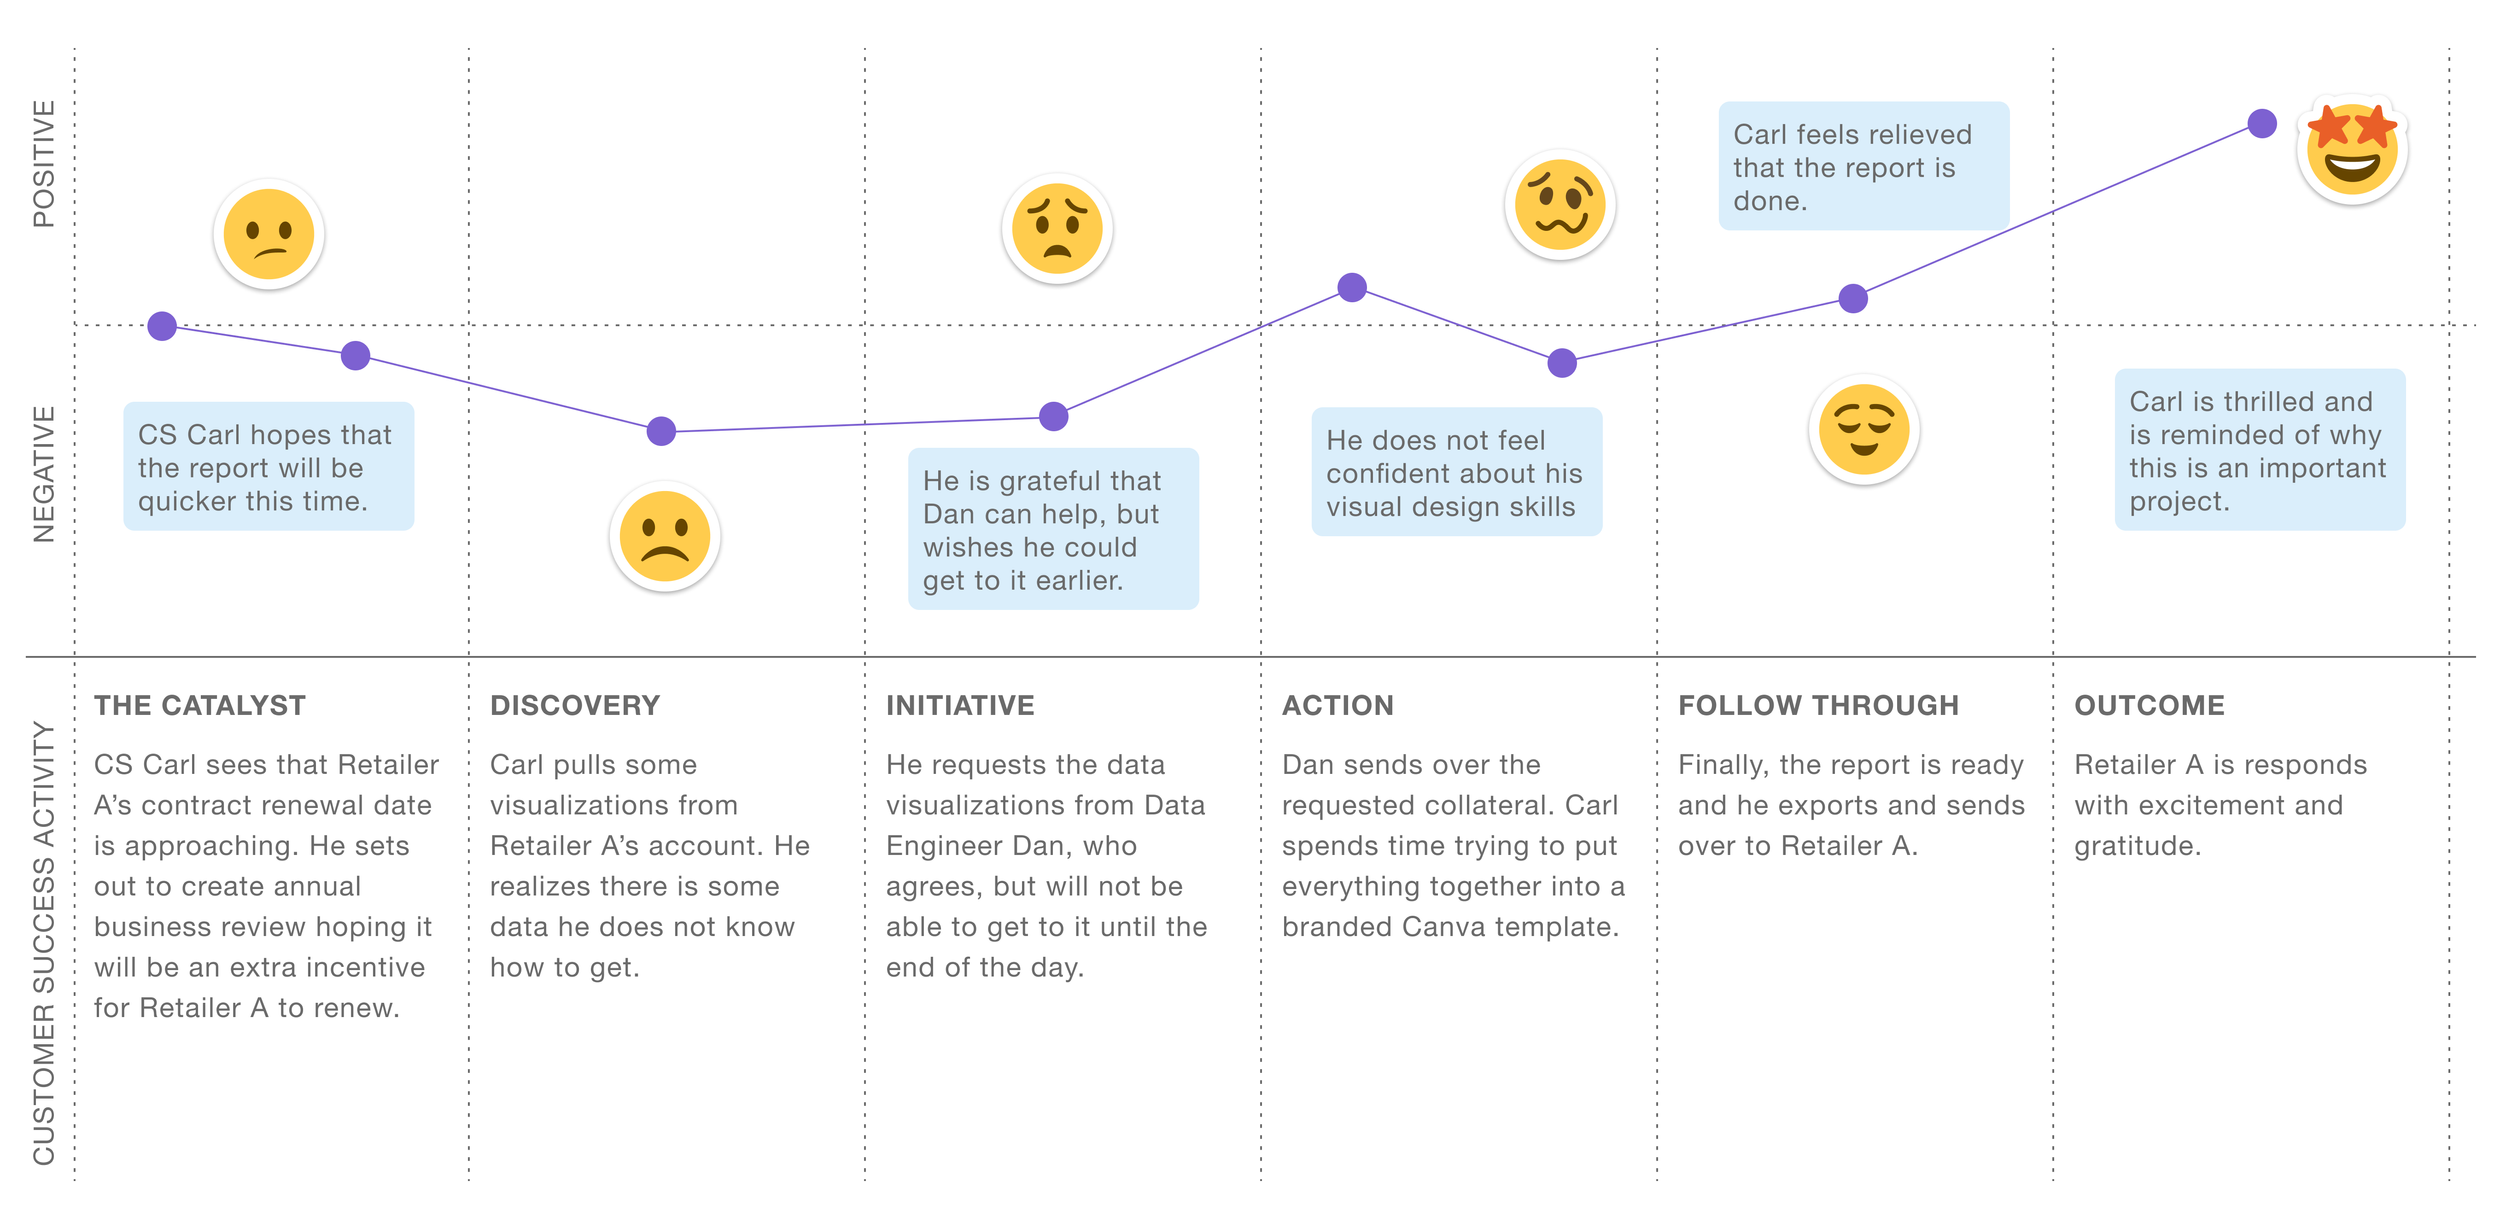
Piecing together the CS journey –
Landing on the Final Approach
Upon reviewing the insights and consulting with relevant internal stakeholders, I landed on the final idea: a Tableau tool that allows the CS team to filter by specific criteria, such as retailer and time frame, to generate a business review report with relevant data visualizations.
I studied Tableau to learn its technical capabilities and limitations.
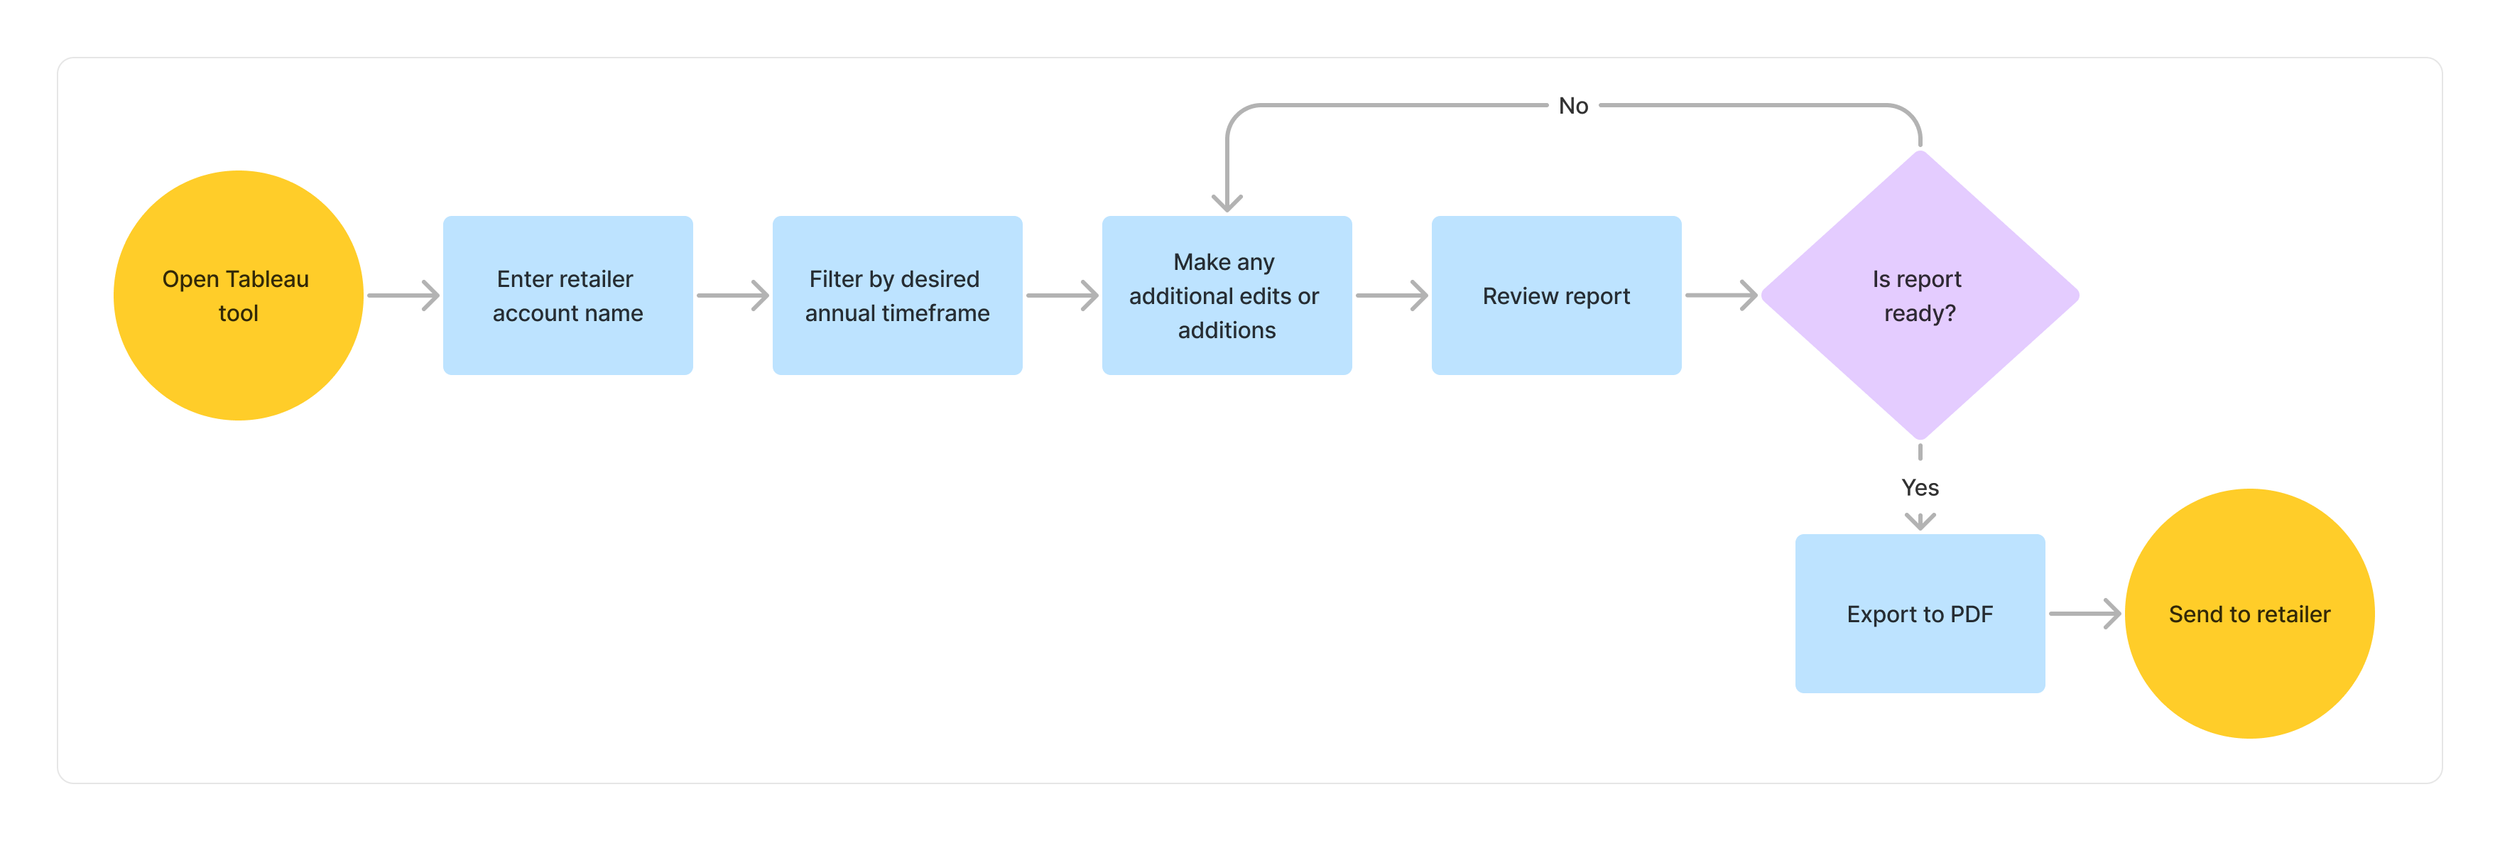
Visualizing the Ideal Workflow
I confirmed with our data engineer that the main information that we really need to filter the data by is the retailer account name in our database and the desired time – everything else is more or less optional.
Designing and Building the Final Tool
After mapping out the ideal flow, I iterated through some different designs before landing on this final setup. I was working within tableau’s design limitations, so I focused on the user flow and experience – how would CS work through this tool to address their problem?
The following are key components of the final solution.
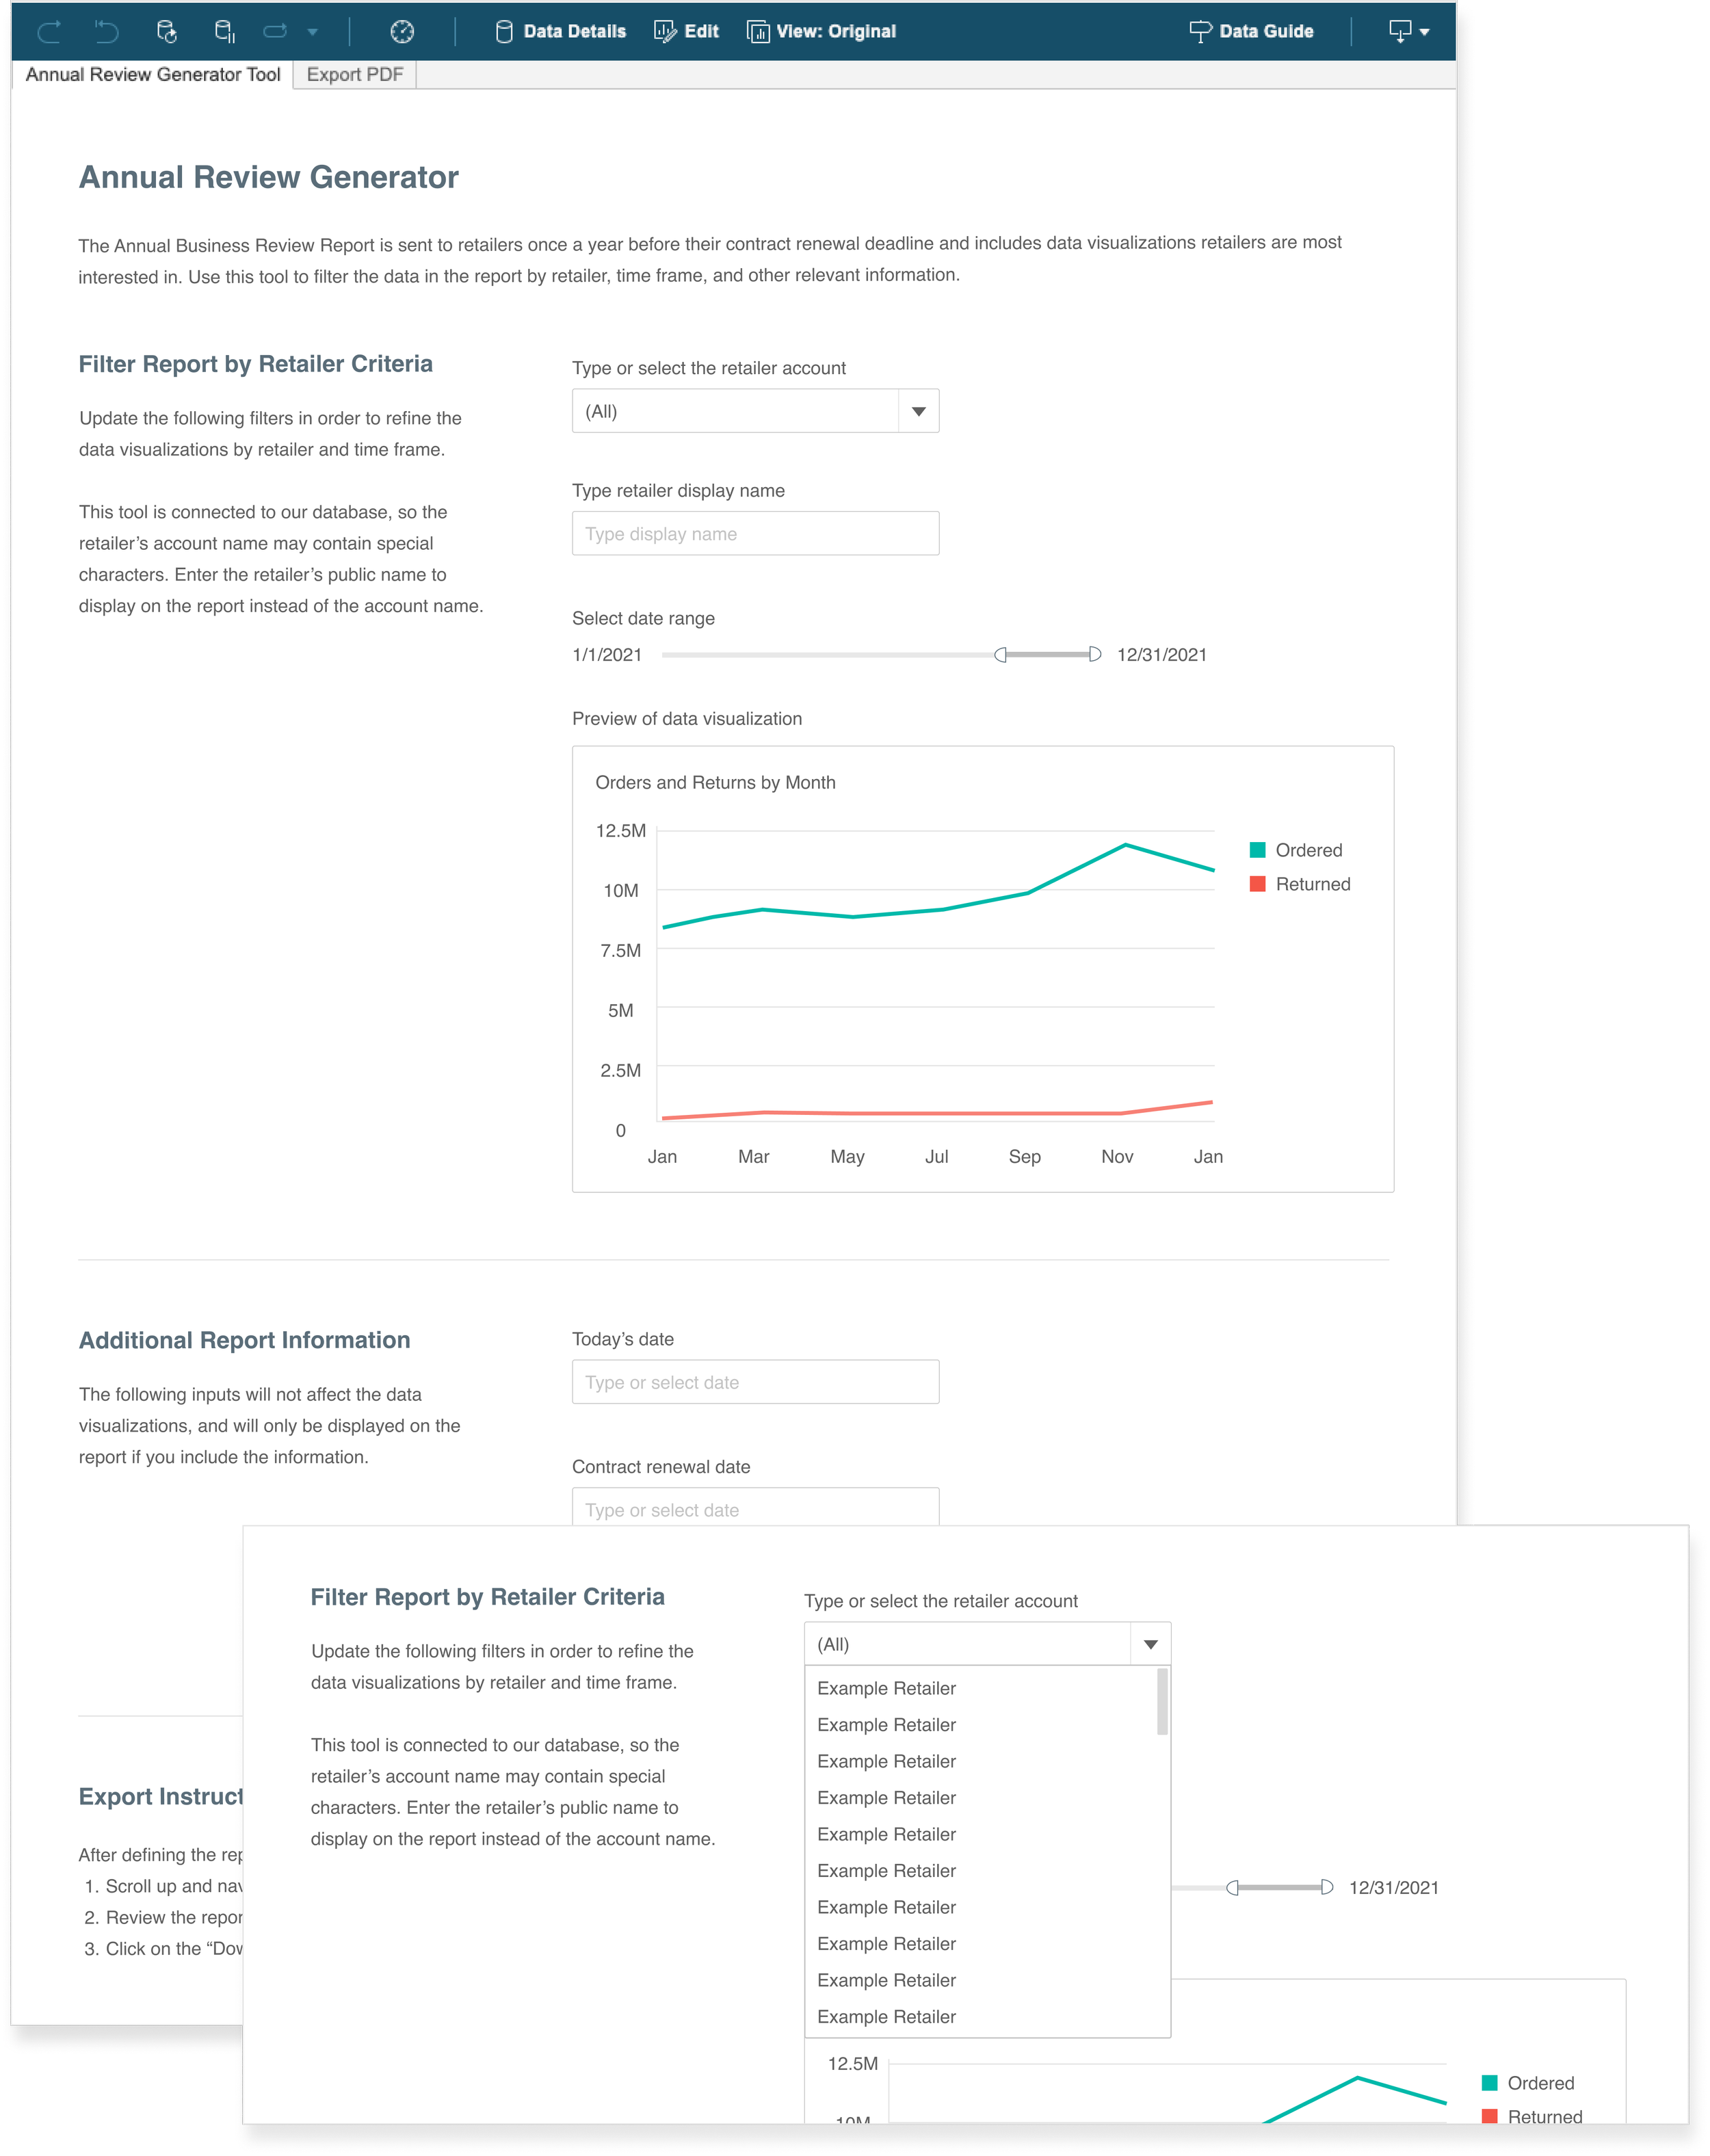
1. CS can filter specific fields to define the data visualizations in the business review report.
2. Responsive/dynamic data visualization preview that provides CS with live updates that responds to their inputs. This provides them feedback to ensure that the filters are working as intended.
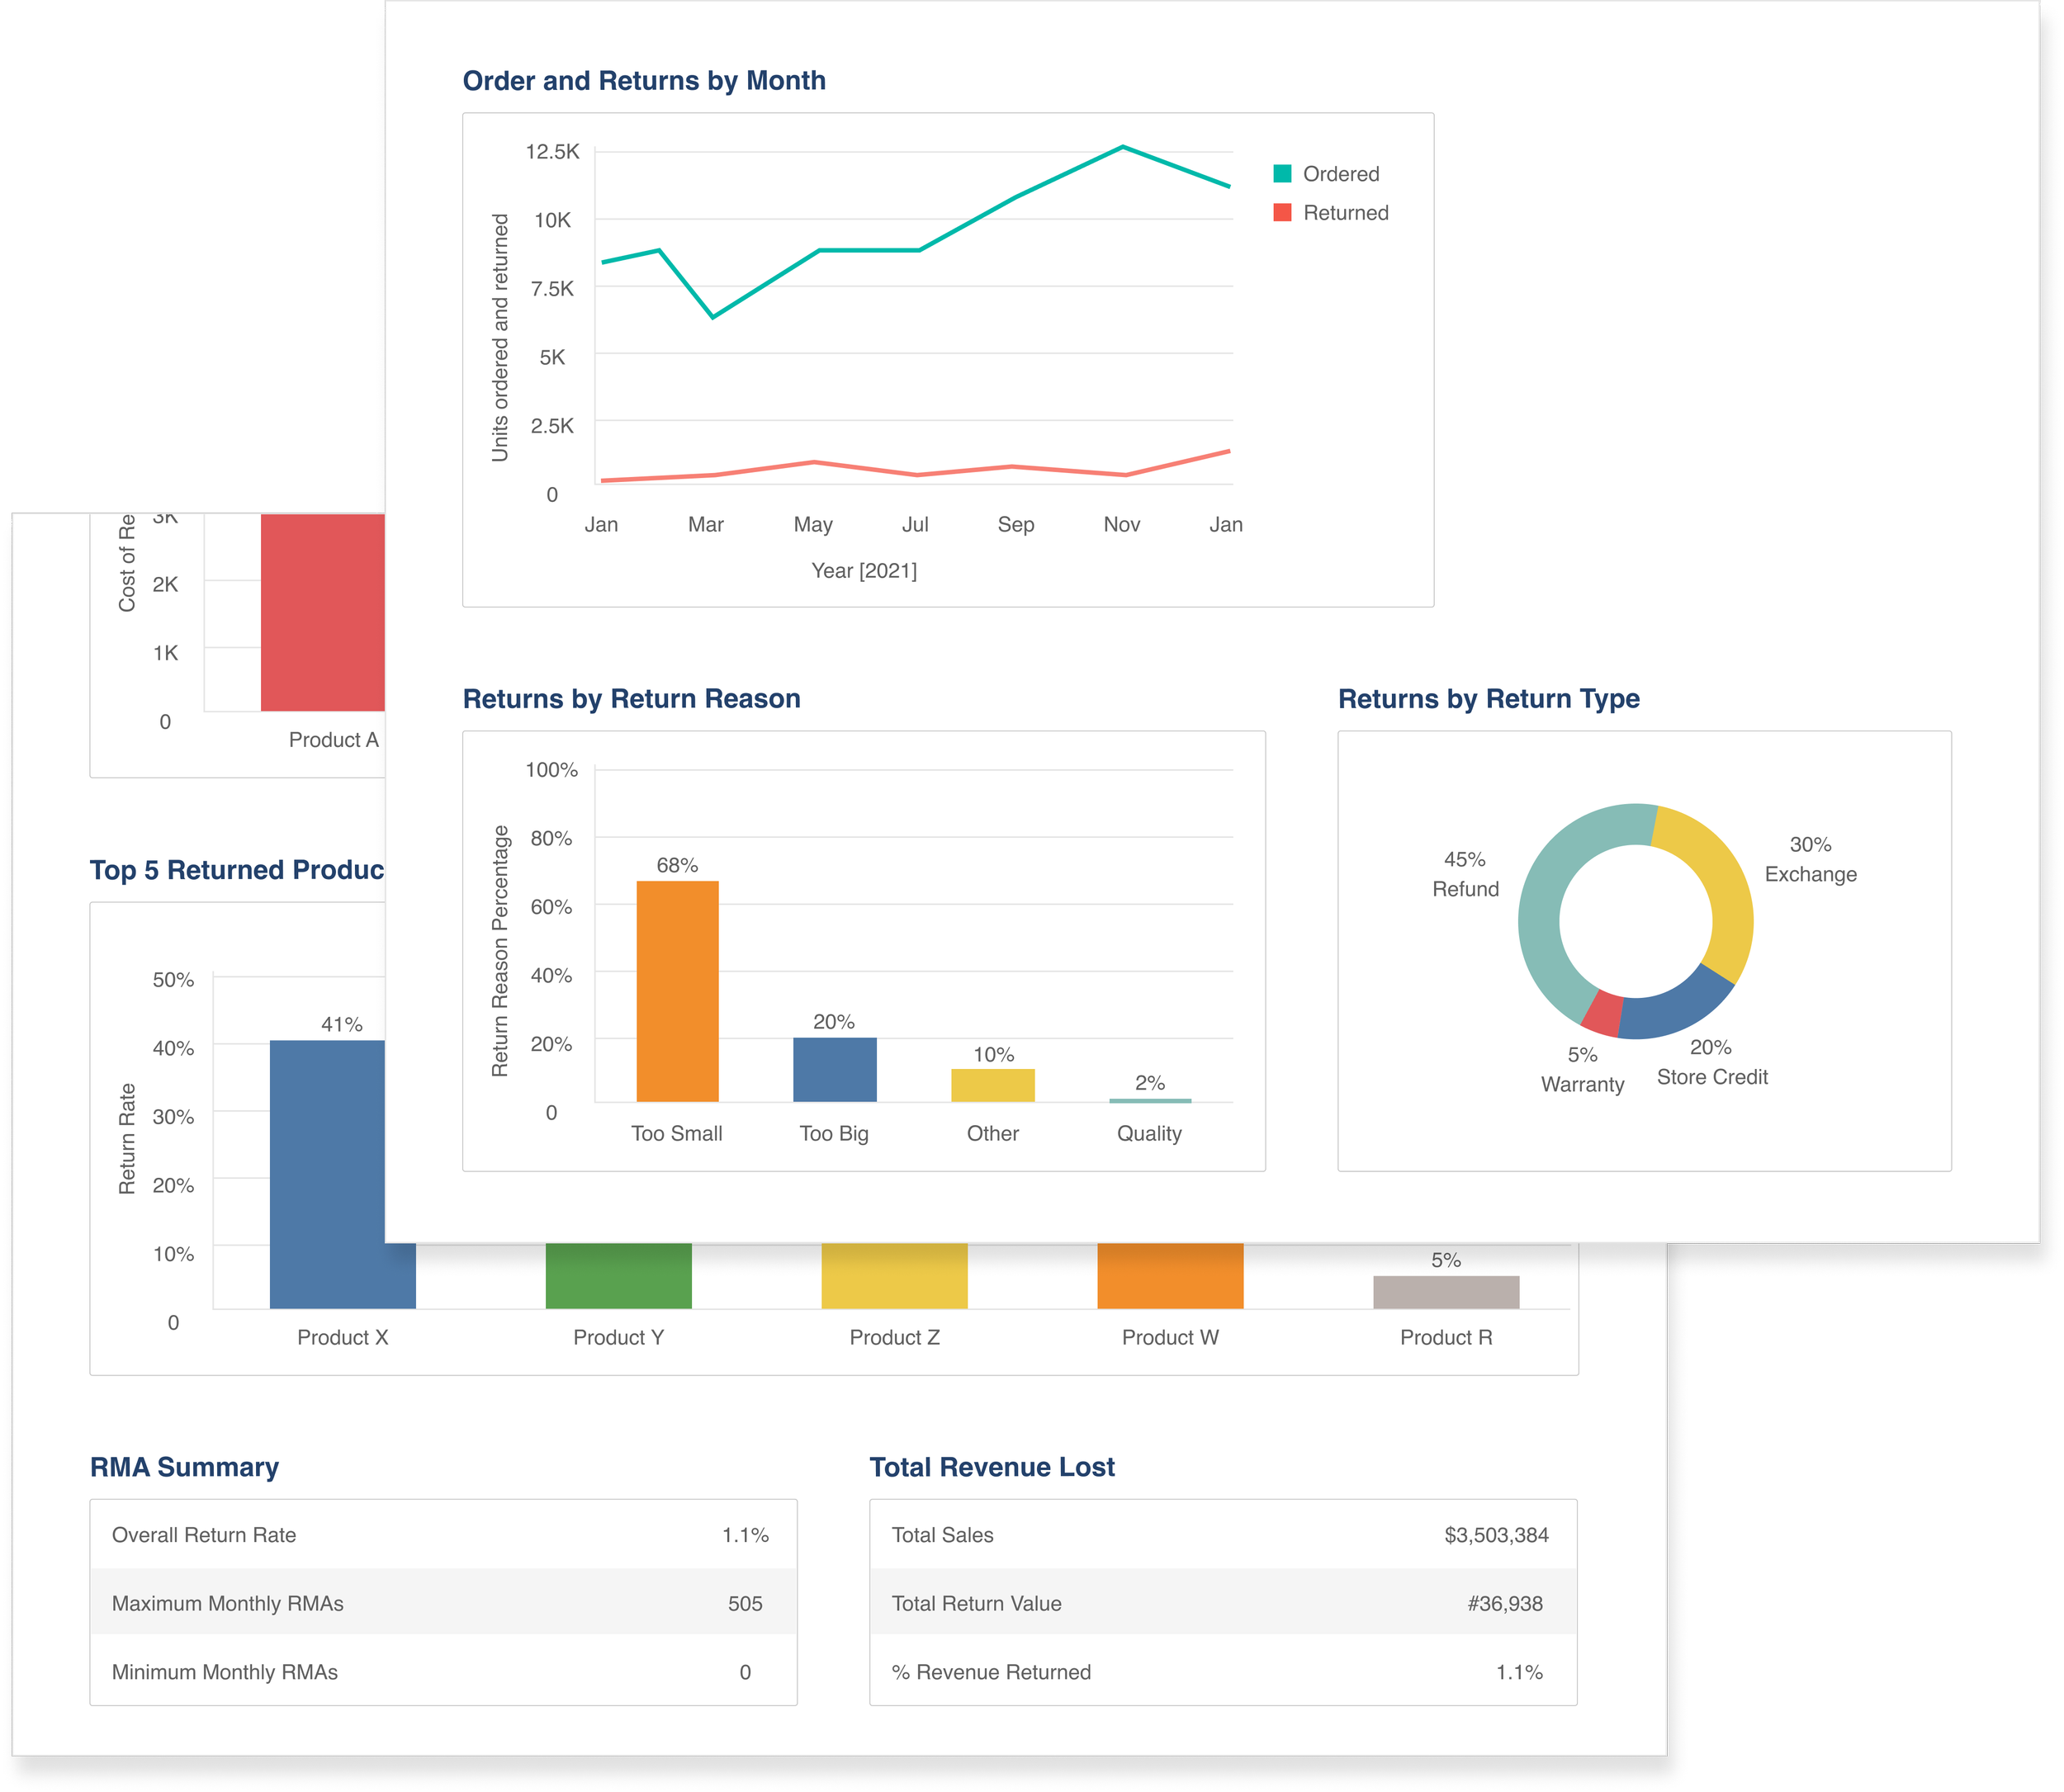
3. Reports will have standard set of data visualizations defined during our initial research phase.
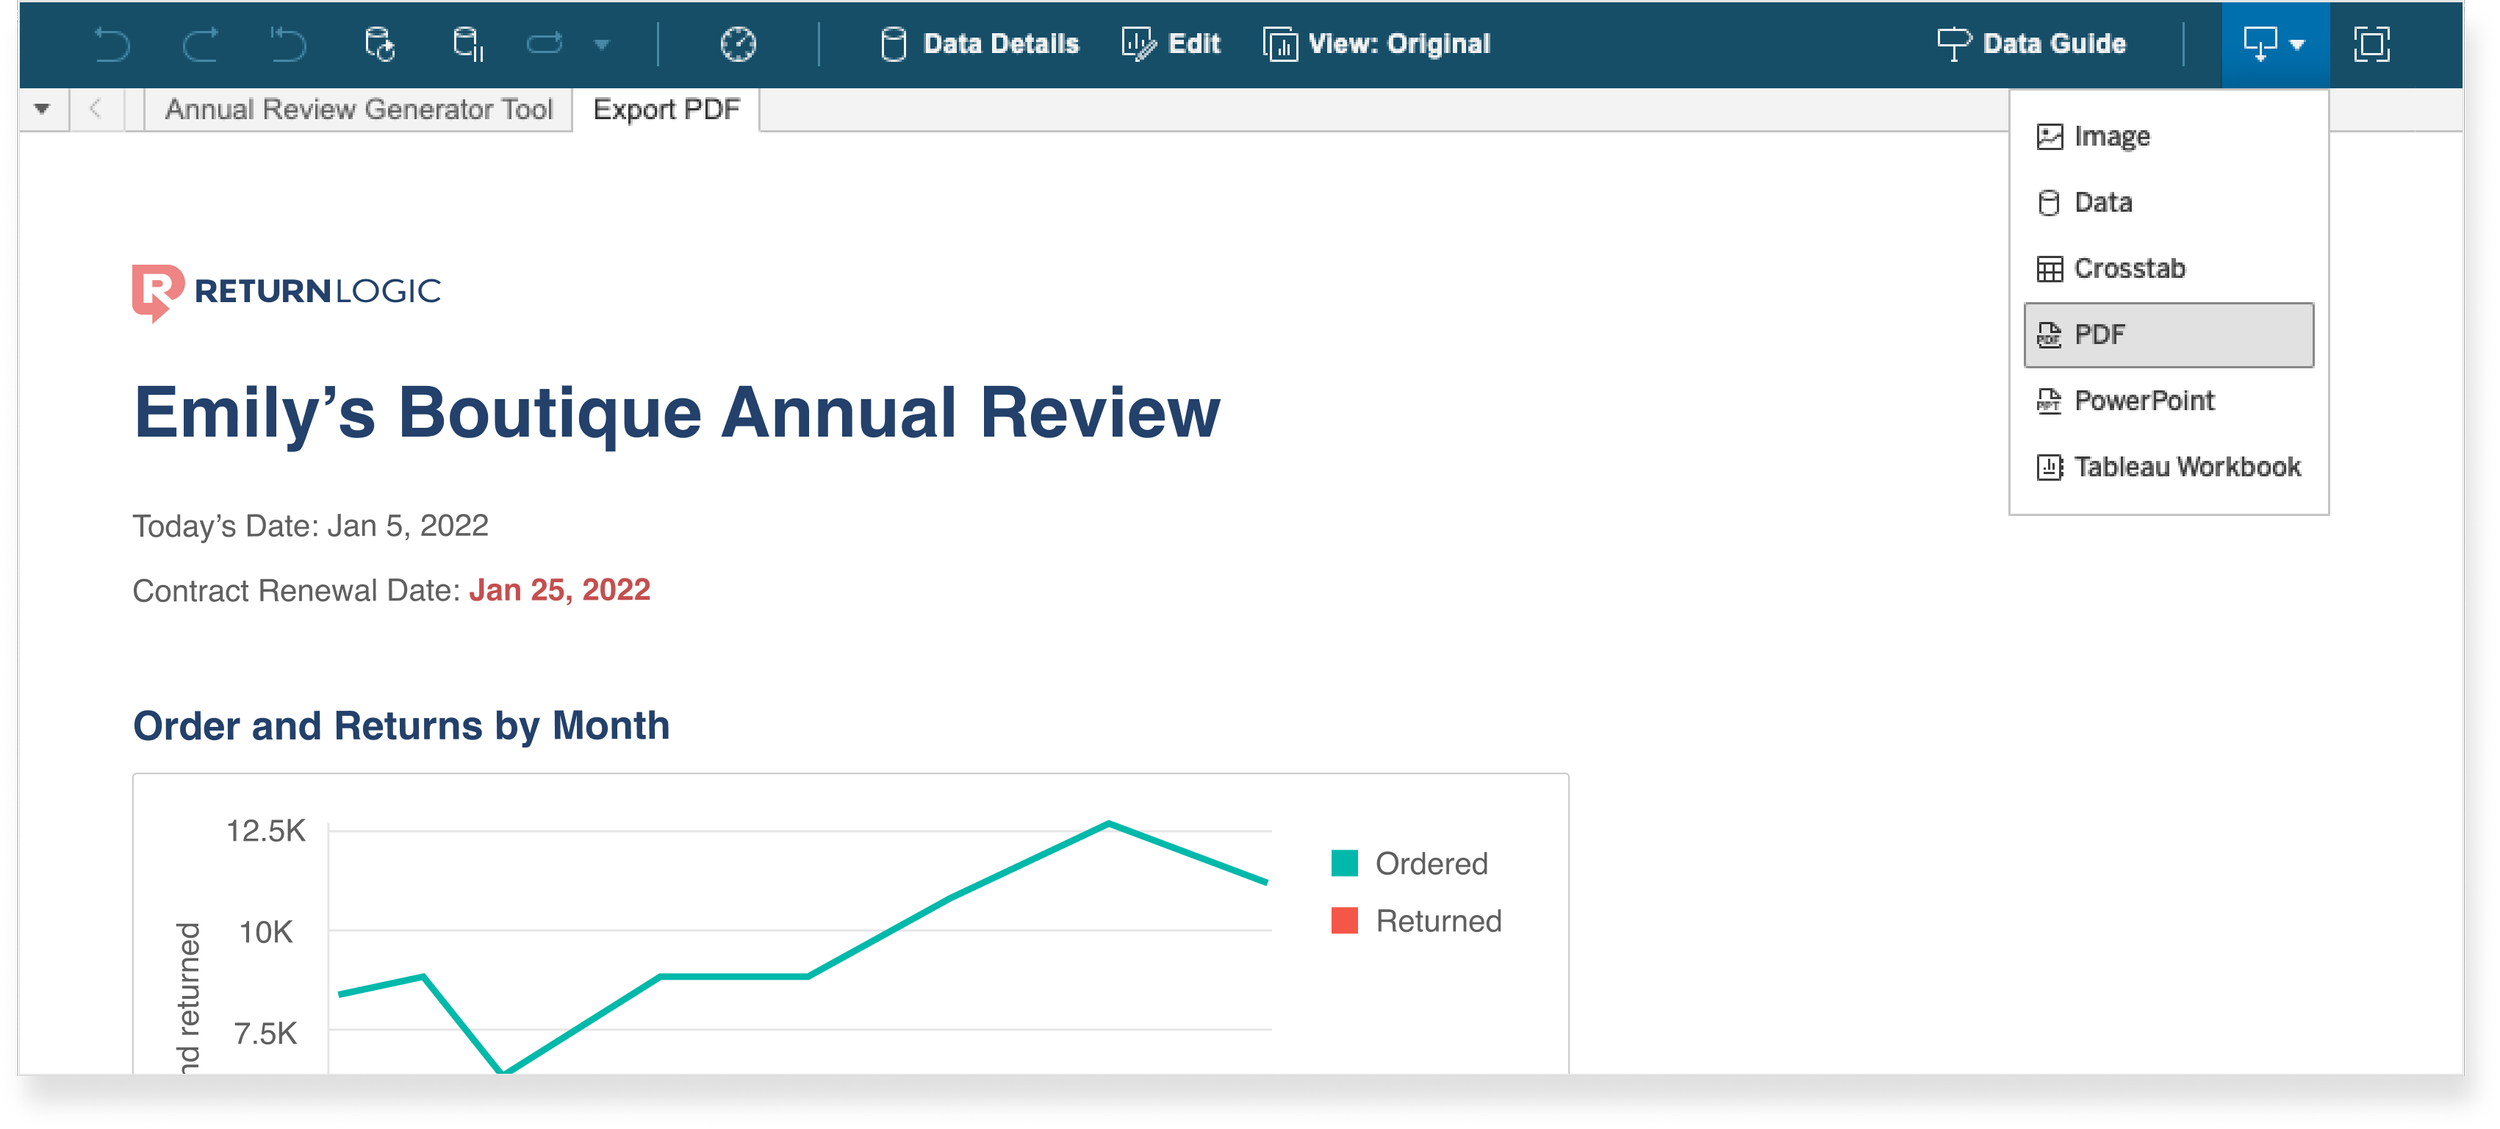
4. CS member can export or download business review reports into PDF directly from Tableau.
I also got approval to build the tool myself in Tableau. This made it a lot easier for me to learn the limitations of the software.
Outcomes
Some exciting results we saw from the tool:
Unanimous CS team excitement and satisfaction.
CS team cut down time creating reports by over 90%, i.e., for annual reports, instead of 30 - 60 mins, they can create them in less than 5 minutes.